Methodology
TELEVISION CONTENT ANALYSIS
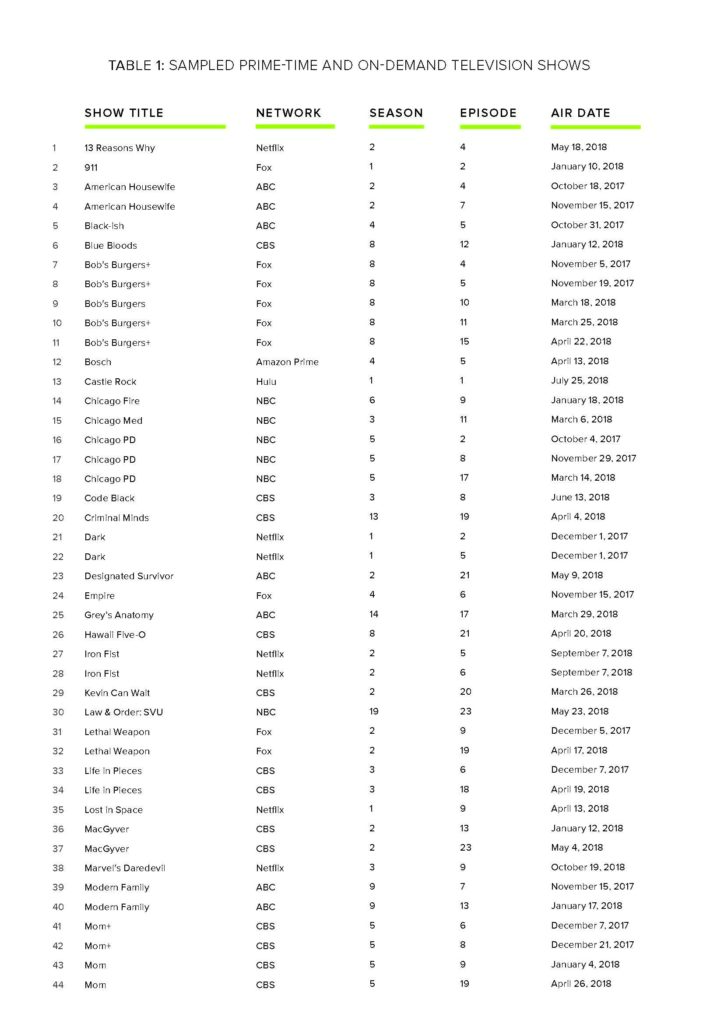
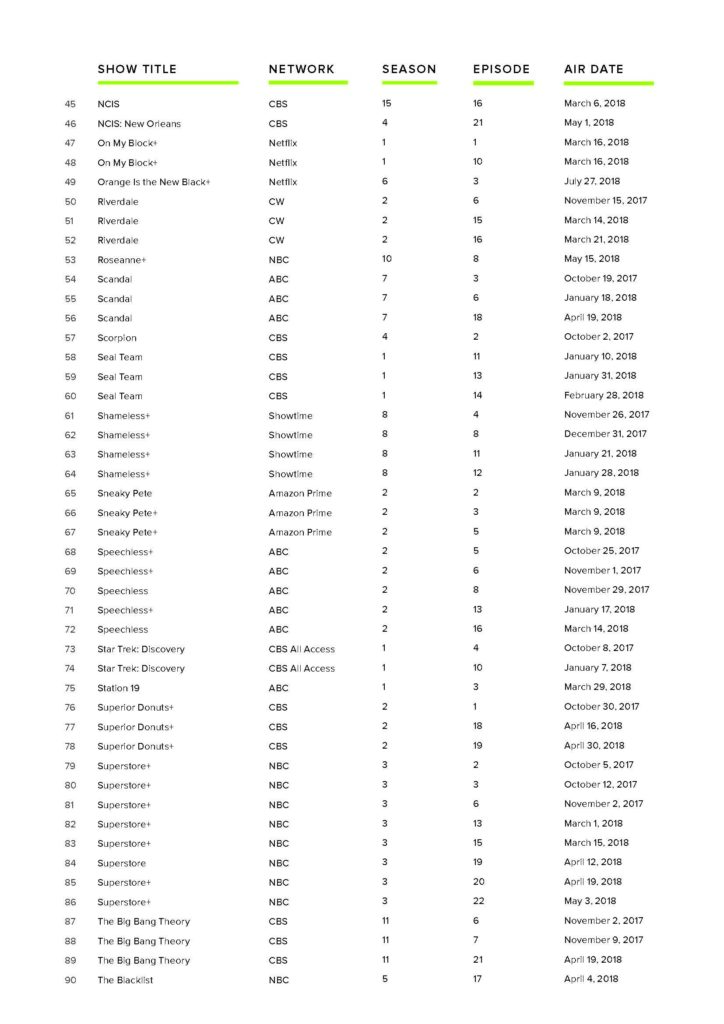
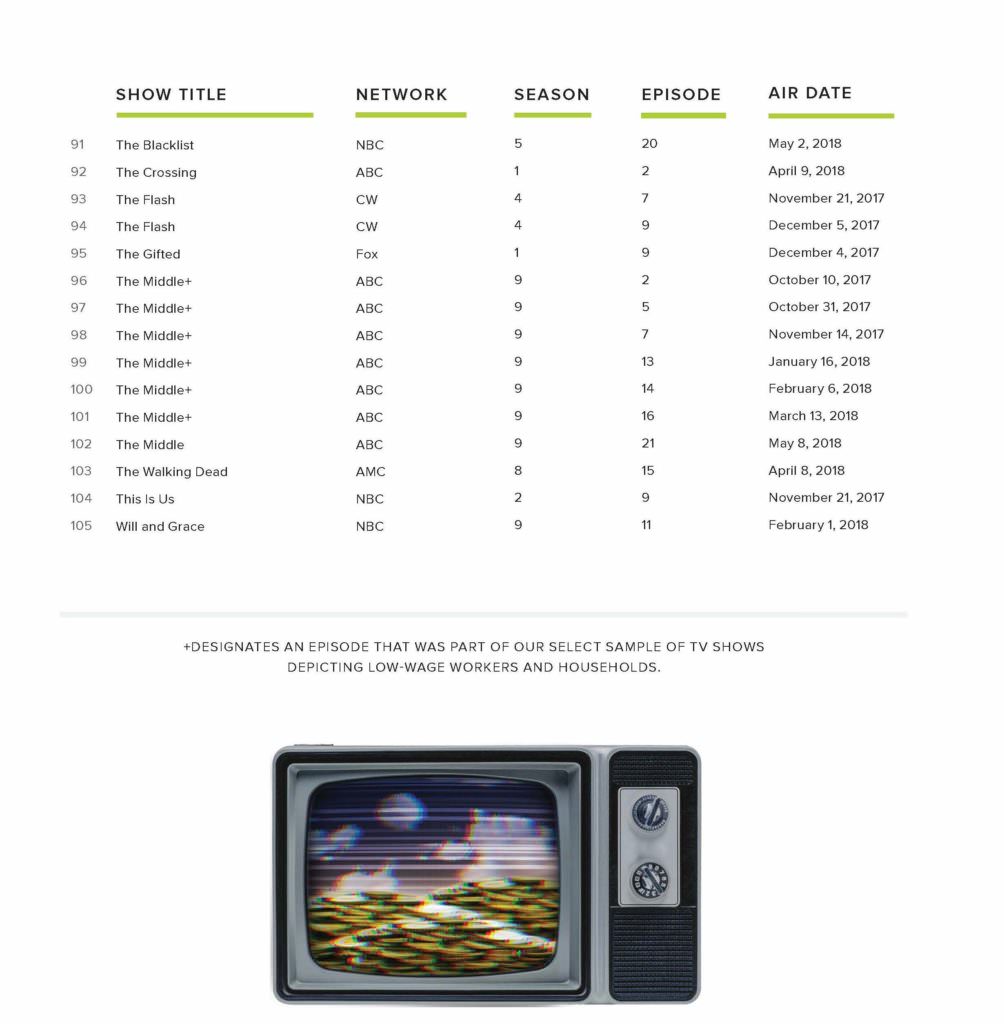
The television analysis in this report is based on content analysis of 105 randomly sampled television episodes from popular television shows aired on broadcast, cable, and streaming services divided into 70 episodes reflect-ing the gamut of shows available during the Fall 2017 to Spring 2018 season and an additional 35 episodes reflecting low-wage workers from this same period.
For the purpose of this study, popular television shows were defined as shows that attracted a large general audience when originally aired on broadcast and cable networks in the United States and/or shows that were ranked high on Parrot Analytics’—the singular source compiling international demand for streaming plat-forms—The Global Television Demand Report: Full Year 2018.[5] In an effort to better capture these emergent consumer habits, our population of popular television shows was generated using a combination of traditional rating metrics from consumer habits research firm Nielsen[6] and viewership measurements compiled in the Global Television Demand Report.
After compiling a sample reflective of the most in-demand shows, we utilized the Microsoft Excel function RANDBETWEEN to select the first 40 episodes. To remain consistent in the manner of sample selection within the Power of POP series, we made use of Research Randomizer, an online random sampling tool, to generate a random number sequence to the remaining episodes for in-depth content analysis.
SAMPLE
The 105 episodes included in our random sample include 44 comedies, 15 action shows, 16 dramas, 14 crime shows, six comedy-dramas, three science-fiction shows, two mysteries, two horror-dramas, one action drama, one reality television show, and one comedic crime drama. Forty-one shows aired on broadcast television (CBS, ABC, NBC, Fox, and CW), two were aired on cable television (AMC and Showtime), and 11 originally aired on streaming services (Amazon Prime, CBS All Access, Hulu, and Netflix).
Part of the overall sample includes 35 episodes selected based on the marketing of certain shows portraying the experiences of low-wage to working-class characters. A brief list of these shows was compiled, and the randomizer tool mentioned above selected episodes from the following programs: Bob’s Burgers, Mom, On My Block, Orange Is the New Black, Roseanne, Shameless, Sneaky Pete, Speechless, Superior Donuts, Superstore, and The Middle.
CODING & TERMINOLOGY
To ensure inter-coder reliability,[7] the coding team created and then trained using a project codebook (see Appendix I), which established guidelines for the specific episodic and character variables to be analyzed. The codebook includes 12 episode variables, including genre, tone, and depiction of low-income lifestyle, and 27 character variables used to identify the likely income of a character. To ensure more accurate character counts per episode, we made use of both coder notes and IMDb databases. In the coding of episodes, a low-income character was defined as any person working in a position whose pay fell within Pew Research Center’s definition for low-wage work (below or at $40,100 per year).[8] Middle-income characters were defined as those who made between $41,000 and $120,400 per year, and high-income characters earned more than $120,400 per year. Using Glassdoor, coders used character job roles and location to define their yearly income expectancy.
In addition to the wage observation, the following qualitative criteria were used to identify characters working for low wages:
An explicit reference was made to a character’s low-income or working-class status in the context of the show or storyline.
Particular social markers were used by show creators to implicitly signify low-income characters. Signifiers identified include poor or insufficient housing, food insecurity or scar-city, lack of social safety net when confronting money insecurity, and dependence on social programs.
LIMITATIONS
The goal of this research is to provide insights into patterns of representation in popular television shows and the potential use of these representations to mobilize audiences. As such, this research makes use of both qualitative and quantitative content analysis methods. However, because of the relatively small sample size compared to the overall population, it is important to note limitations in the generalizability of our research findings. In future studies, we aim to analyze a larger sample size, including a survey of the impact of these representations on the directly impacted.
Because streaming platforms are constantly changing contracts and provision of different TV series, we are only able to document the streaming services utilized in our development of the study. For instance, while Superior Donuts may be available on the Paramount Network in 2021, we notated usage of Amazon Prime to gain access to the episode during the timeline of our study within the codebook.
Episodes included in this study were the result of random selection, which means background information about show premise or characters was not strictly observed. Therefore, some of the information collected may miss de-tails that only long-time consumers of a program would know. Where possible, the coders relied on search engines for each program to clarify details like job titles during the season, utilizing fan encyclopedia websites when necessary. All levels of education not stipulated on the screen were instead determined by minimum job requirements